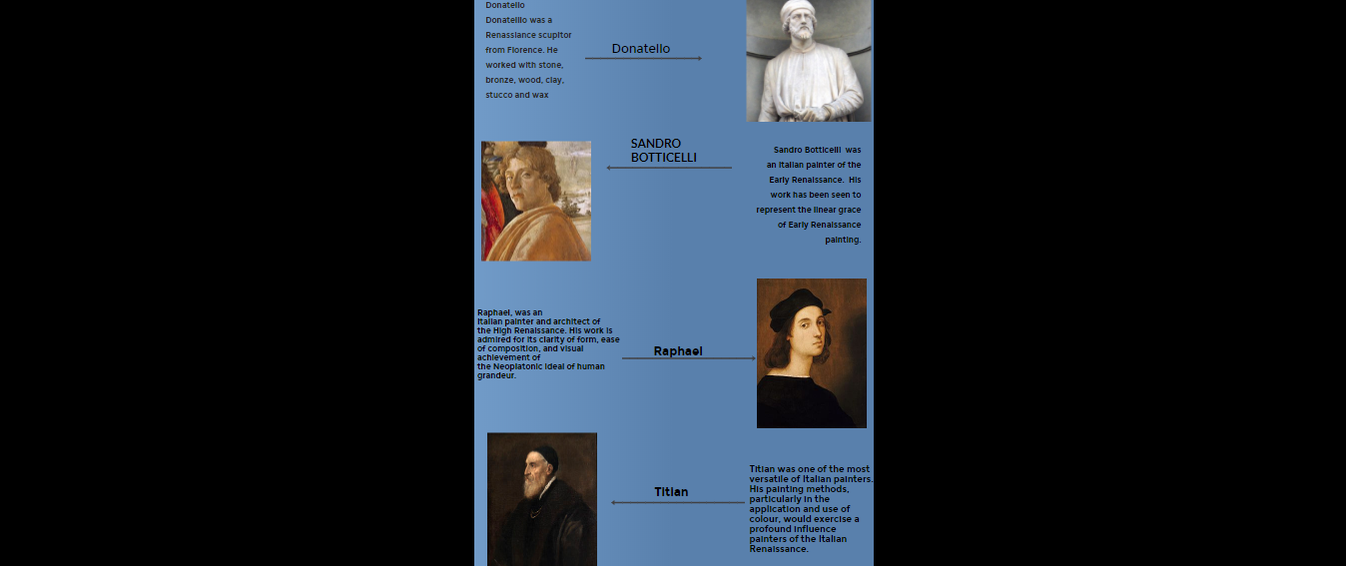
Info Graphic using Visme
Making this Info- graphic was a feat in itself. I first tried using pickto-chart and ended up hating that because to me it was to complicated. I decided to play around with the different options and the one that I ended up like the best was Visme. Visme was so much more easier to operate. The only thing that I did not liek about visme was the the graphing. The graphing of where to place things on Picktochart to me I thought was alot better because it showed how it would align with everything on the page. With Visme it only showed how to align with cetrian things like titles and pictures. But overall my exprience with Visme was a much bettter one, one in which I did not get frustrtated with. Visme the app was free overall I didnt see any add on's or anything that was premimum cotent in which you had to purchase. I think a way that I would use this in a Social studies classroom would be to use it for either timelines or comparing contrasting of either a country or time period. The theme I used for my info graphic was timeline but I just altered it to fit my content needs.
https://my.visme.co/projects/jwv6kkok-artists-of-the-renassiance?isPreview=1
https://www.visme.co/
https://my.visme.co/projects/jwv6kkok-artists-of-the-renassiance?isPreview=1
https://www.visme.co/
|
Check out my Pinterest Board to see more examples of Social Studies info graphics that I will be integrating into my classroom!
|
This is a button for a tutorial on how to use Visme. Visme actually creates their own tutorial which can be found on their website!
